Fiber System Testing
Figure 1 - The Fiber system with my accelerometers mounted onboard the tool head and coupling mechanism
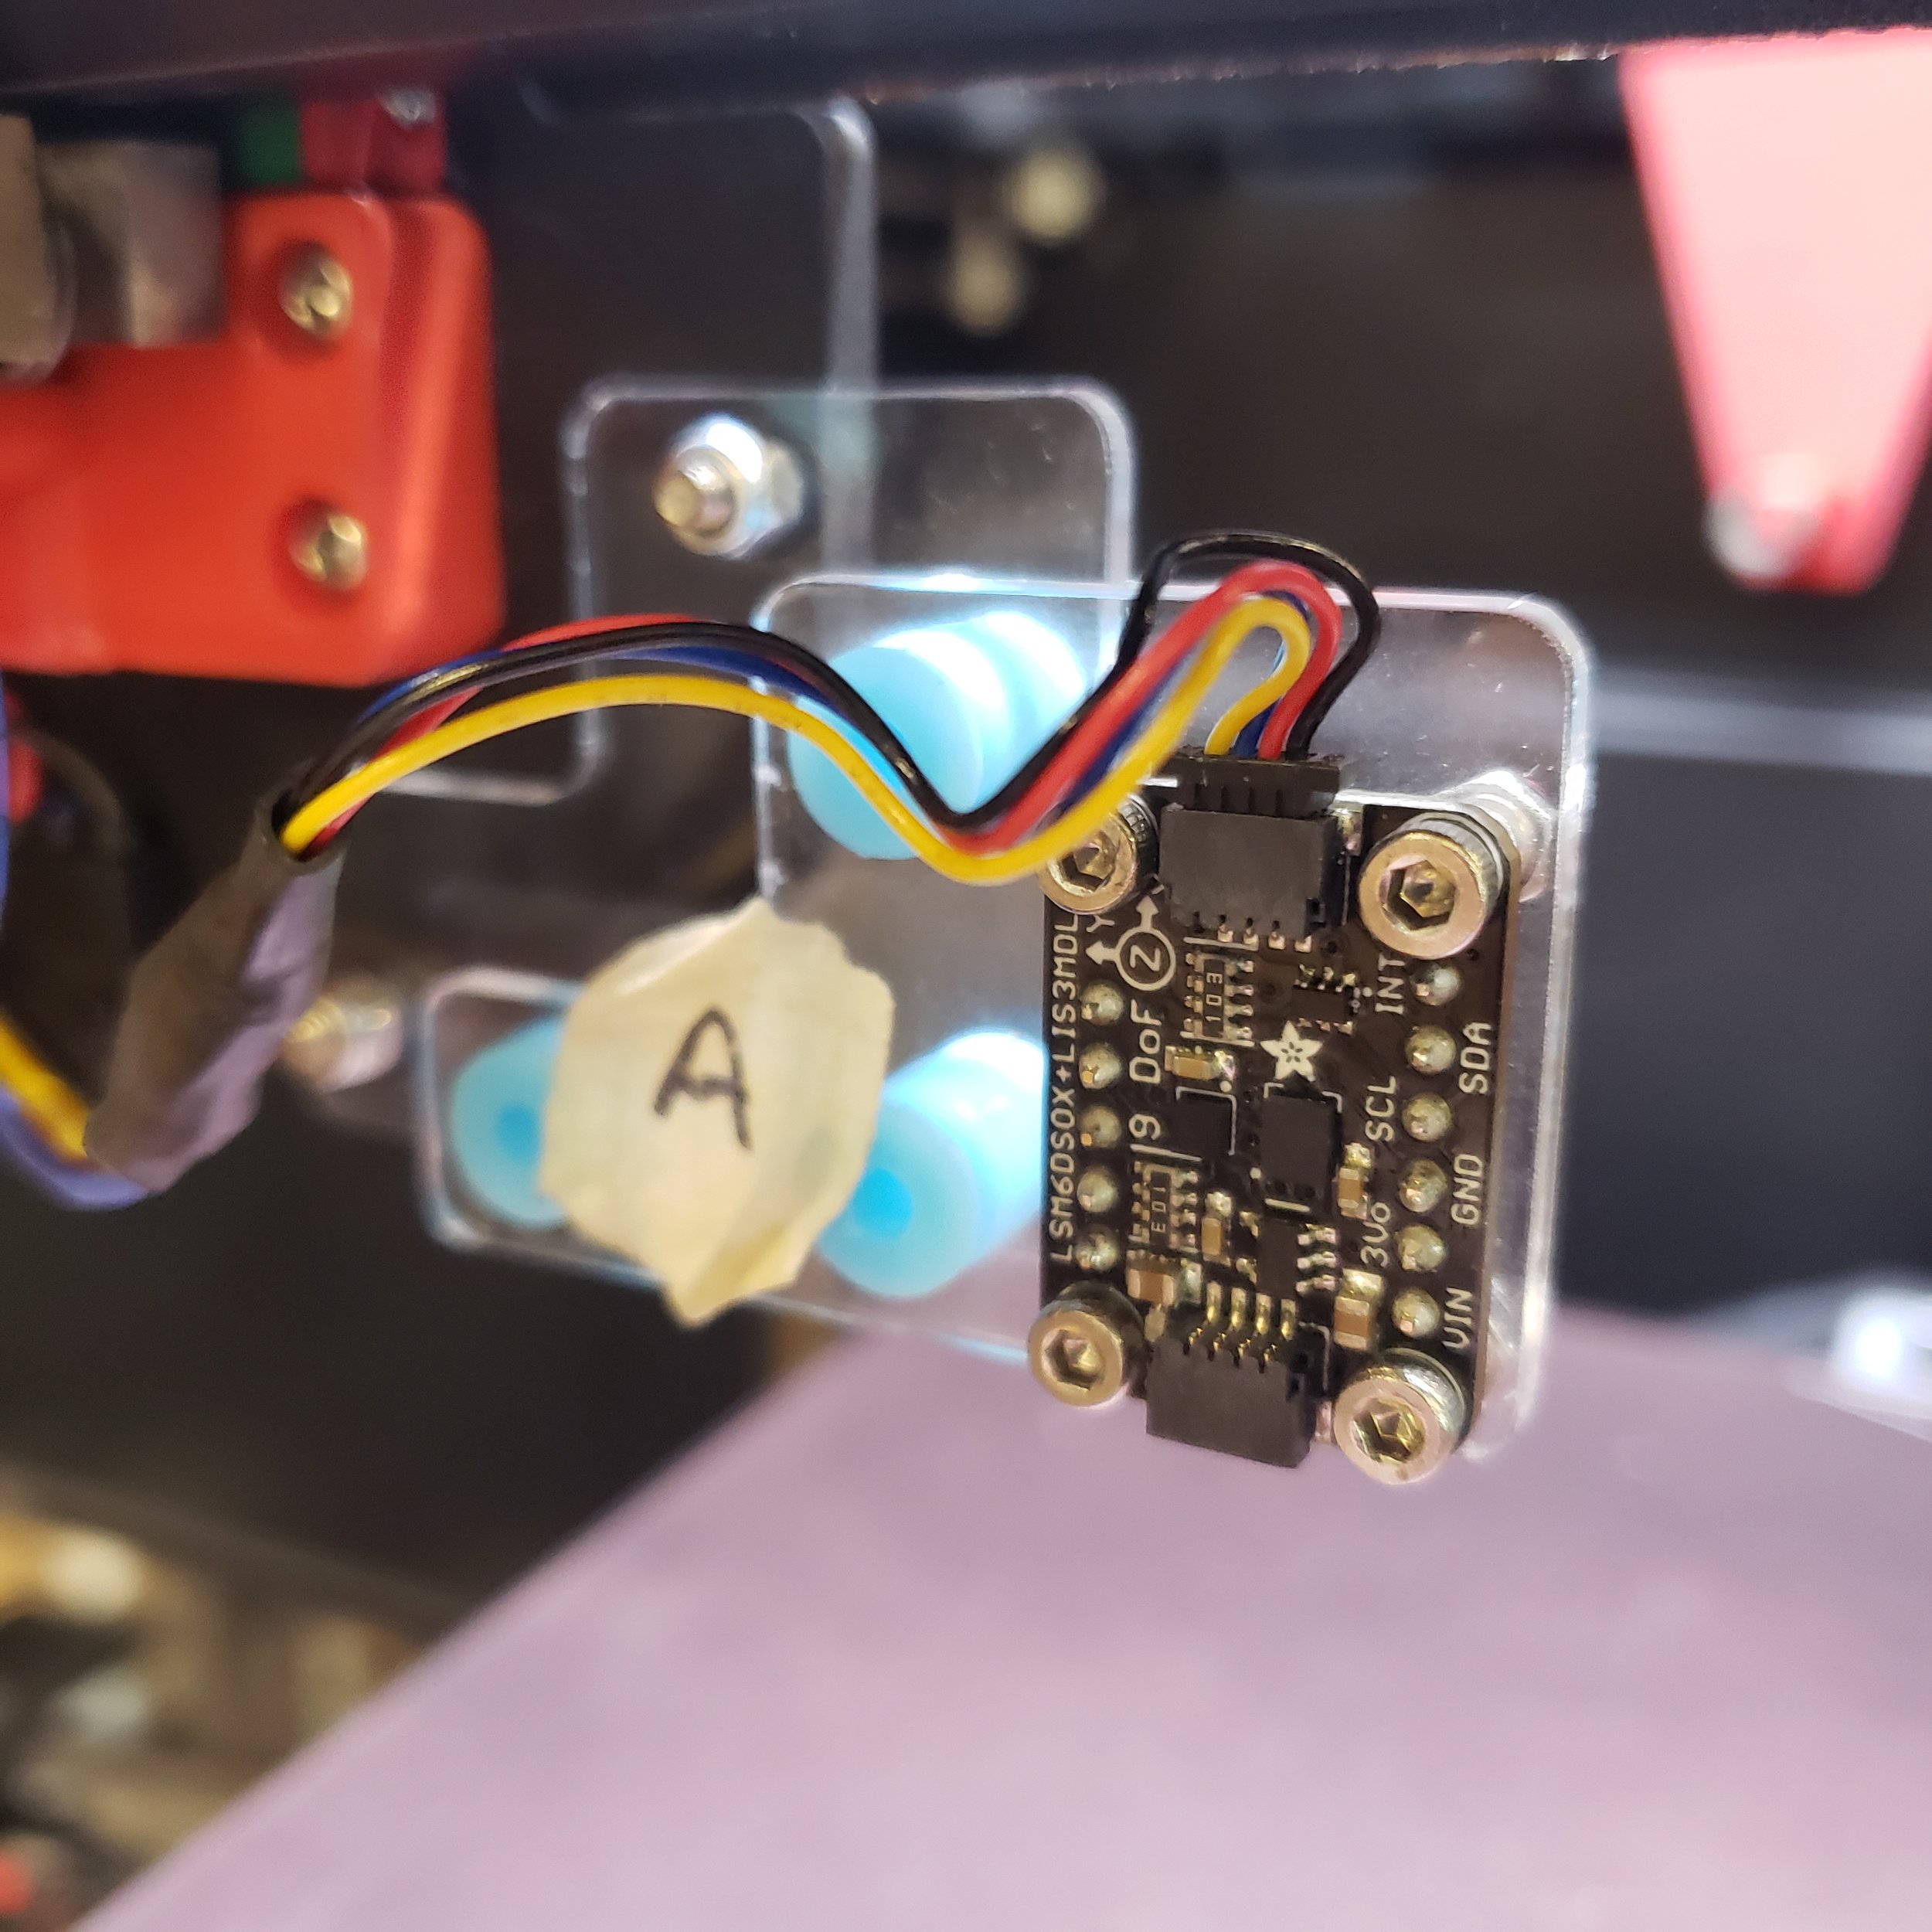
Figure 2 - Close up of the accelerometer mount onboard the tool head.
Figure 3 - Close up of the accelerometer mount onboard the tool head.
As a part of my Desktop Metal co-op, I designed a durability test for measuring when the tool-changing mechanism of Desktop Metal’s Fiber system fails while it loads and unloads a tool. My approach to this test was to have two Inertial Measurement Units (IMUs) and compare their respective linear and rotational accelerations. In the ideal case, if the tool head is perfectly mounted to the coupler mechanism, then both IMUs would experience identical accelerations if they hit a bumper. However, if the tool is loosely attached, it will experience a change in acceleration before the coupler does.
I used an LSM6DSOX Inertial Measurement Unit (IMU) and an STM32F405 Featherboard from Adafruit as the microcontroller. I wrote and ran code onboard the microcontroller to read and log data from both sensors onto a micro SD card. I mounted the Featherboard on the top of the printer chassis and routed extended wires to the IMUs. I used a laser cutter to cut acrylic plates to mount and vibrationally isolate the IMUs. I designed the plates such that they mounted to existing hardware onboard the coupler and tool head so as to not interfere with tool changing or sensor readings.
Now Let’s Have Them Bump Into Stuff
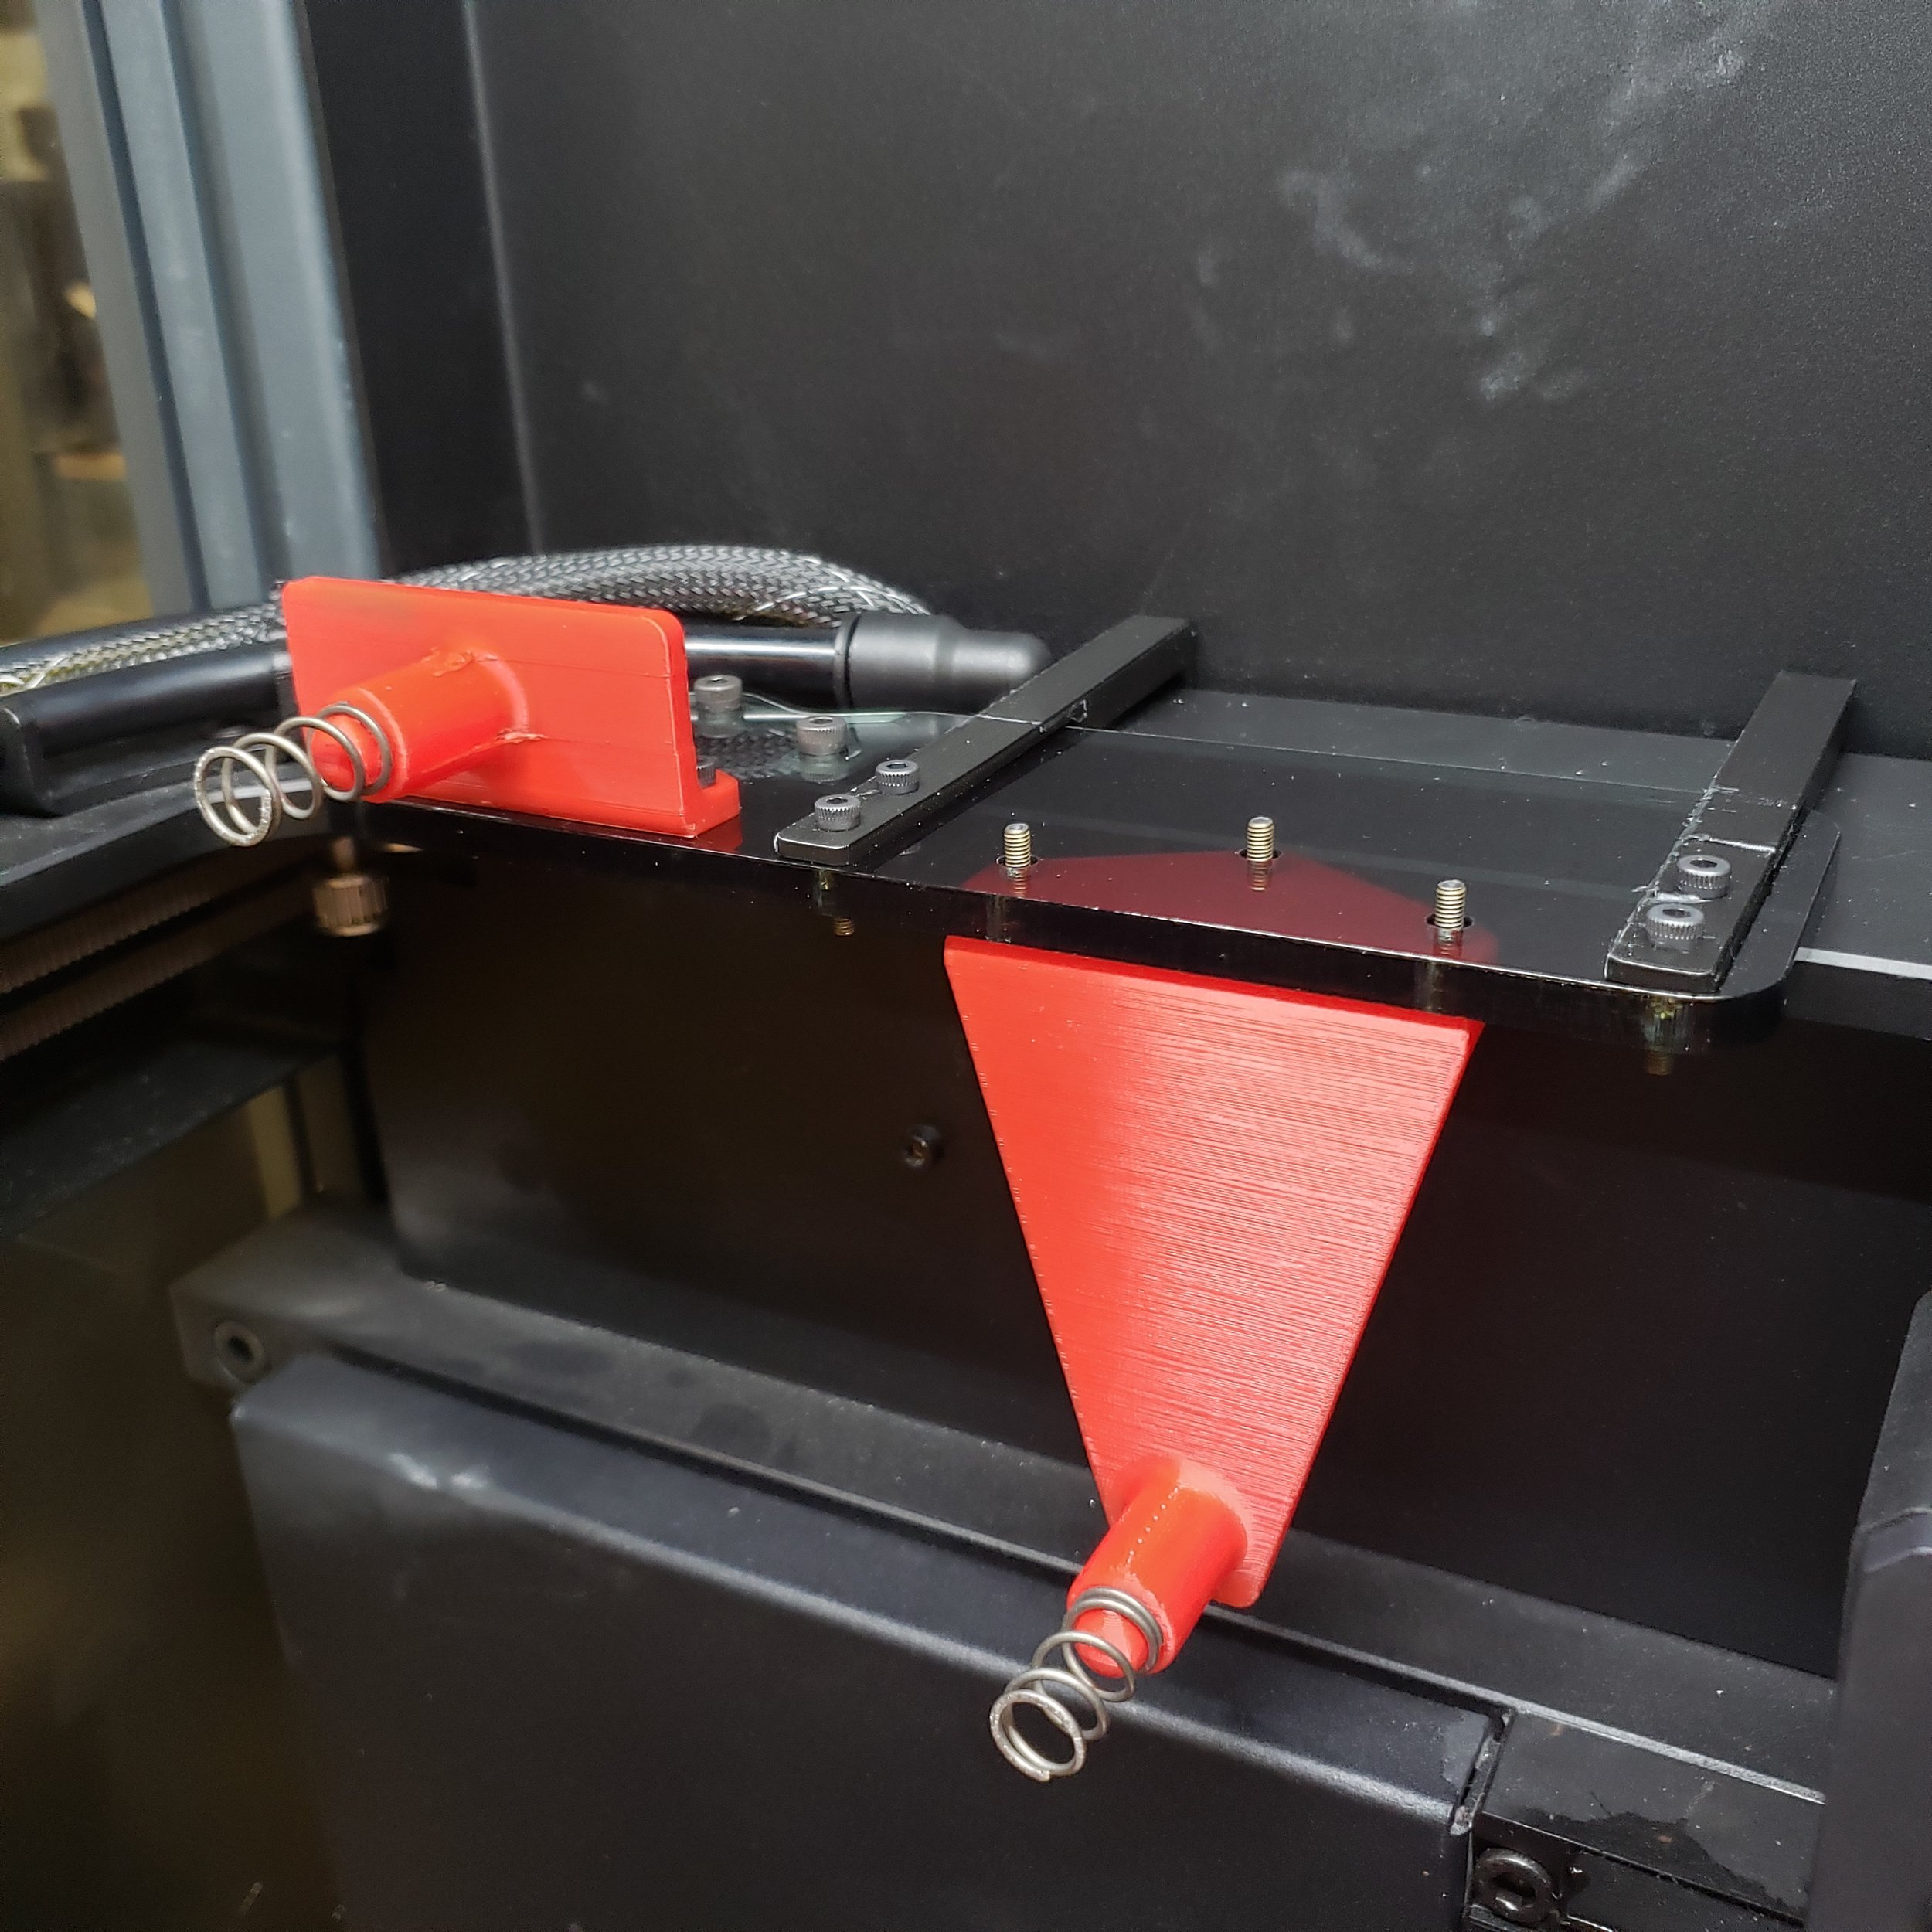
To test if the tool was properly mounted to the mechanism, I designed a bumper assembly. I mounted two springs to check whether the tool was loose in one direction or another. I used brass press-fit inserts inside a thick acrylic plate to house the 3D-printed spring mounts. To run the test automatically, I accessed the machine’s Duet board to program a G-Code script where the printer would repeatedly couple with a tool, touch two bumpers, and uncouple. The video shows the Fiber printer running my G-Code and the IMUs streaming its output through the Arduino serial monitor. You can see every time the tool coupling mechanism bumps, there is a spike in acceleration in the serial monitor.
Figure 4 - Close up of the bumpers mounted onto the Fiber system’s frame.
Figure 5 - Close up of another set of bumpers with stiffer springs.
Figure 6 - My G-Code script I ran to automate testing.
Video 1 - Fiber system performing a coupling durability test.
Roughness Plate Testing
Figure 1 - My roughness test set up using a Mitutoyo roughness tester.
Other than Fiber system testing, I investigated how to obtain different roughnesses for various machining processes in order to verify whether roughness affects print processes. The company’s production series printer uses binder jet technology to print metal parts. Therefore, it is important that the base plate, which has parts printed on top, does not let metal powder slip. However, we didn’t know whether the base plate’s roughness affected the print quality. So, my goal was to understand how to control the average roughness (Ra) of a piece of stainless steel and whether it affected print quality.
First, I modeled how a single-bit fly cutter could be used to achieve a controlled average roughness. Using the Desmos graphing calculator, I generated a model that used a set of parametric equations to drive the circular cutting shape. I then set the model so that if the feed was higher, the roughness would be lower.
I tested my model on a piece of 17-4 stainless steel and machined four surfaces, two on each side. I would place the piece in a milling machine and have a fly cutter with one-bit cut knurled surfaces. I would have the cutter move at a fixed speed but change the feed rates. Since the cuts were circular, the edges of the surface had a lower Ra than the middle of the cutting path.
In addition to knurling, I used an orbital sander to apply various grits of sandpaper to the surfaces. This allowed me to compare the roughness results from a manufacturing process to the knurling.
After machining, I used a roughness tester from Mitutoyo to understand how roughness changed depending on how close the needle of the tester was to the centerline of the knurled pattern. For 12 tests, I took a minimum of 30 measurements. From the tests, I found the average roughness was directly proportional to the feed rate of the fly cutter during machining. Furthermore, machining surfaces yielded Ra values above 1.5 microns, while any form of sanding yielded Ra values less than 1 micron. After I finished collecting data, I worked with Desktop Metal’s machinist to machine surfaces onto the printer’s bed. After it was installed into a prototype printer, technicians printed several metal parts. They found no significant change in each part’s density and strength when printed over different surfaces.
Figure 2 - The planned machined surfaces on top of the printer’s baseplate.
Figure 3 - Average roughness of a knurled surface versus how far away the sample length was from the centerline.


